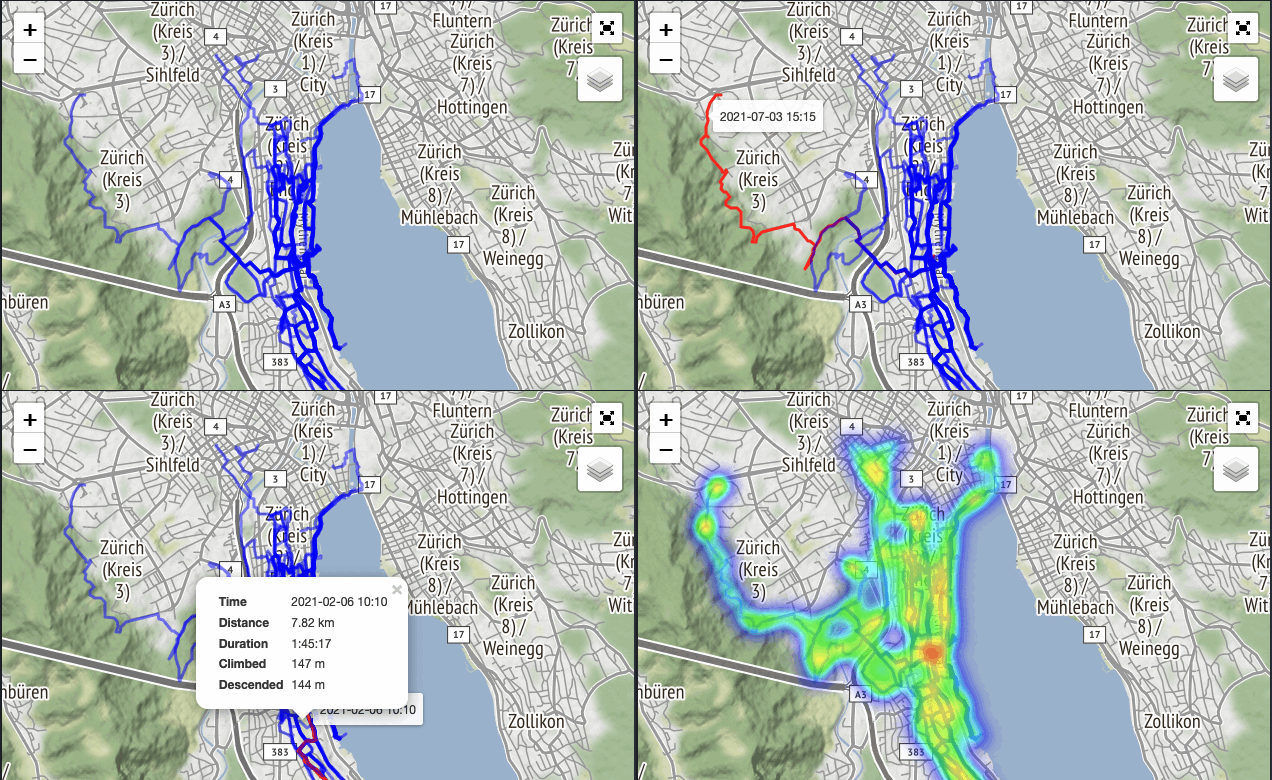
Automated GPX maps
As for 2020, with lockdowns extending into 2021, my girlfriend and I continue our morning commute-substituting walks. We got bored repeating routes we already did and so I decided to visualize our data in some useful and fun way.
In this post I describe the why and how, but if you are here just for an example, you can simply click on the figure above, if you are here for the code, you can find it in this GitHub repo.
Other implementations
Strava allows you to visualize nice heat maps, but only for running, swimming and cycling, and I was interested in walking. Besides, once the heat map is generated, you cannot get information on individual activities, so the functionality is a little limited.
Quantified Self is a really cool open source projects that can connect with Garmin or Suunto and provide most of the functionality I was looking for. However, the web interface is slow and somewhat buggy - and you have to share your GPX tracks with yet another web service.
dérive is a second very cool open source project. Differently from Quantified Self, all the processing takes place in your browser and your tracks are not stored on their (GitHub pages) servers. The only issue with dérive is that, besides visualising the heat map and tracks, there is not much customisation and info on individual tracks. The simplicity and aesthetics of this project, however, are fantastic and inspired me to create my own.
Implementing my own maps
I typically work with Python and have coded several side-projects with it, enough to know that if you can think of an idea you can almost surely realise it with Python - and somebody might have already written a package with some of the implementation (much like with LaTeX).
I was not wrong: I found both garminconnect, a neat package that provides a Python 3 API for Garmin Connect, and Folium, which builds on top of the Leaftlet mapping library and allows to easily create maps from within Python.
Initialization
The first point is not to share your data with more sources than necessary, so
I decided to create a ~/.python-github.cfg file where to store the
configuration for this code.
The file can contain multiple sections (that you can potentially use for
different programs), but it needs this specific section for this code:
[garmin.maps]
GARMIN_ID = your_garmin_username
GARMIN_PW = your_garmin_account_password
GARMIN_ACTIVITIES = walking, running, cycling, hiking
GARMIN_DATESTART = 2021-01-01
Here you can store your credentials, select which type(s) of activities you
want to map, and a start date for downloading your tracks (the end date
defaults to the time the script is run).
This file is parsed by configparser right at the beginning of the code.
config = configparser.ConfigParser()
config.read(os.path.join(os.path.expanduser('~'), '.python-github.cfg'))
The code then starts the logger (which writes stdo/e to log_msg.log),
initializes the Garmin Connect client and logs in.
logging.basicConfig(filename = msgLog,
                    level = logging.INFO,
                    format = '%(message)s',
                    filemode = 'w')
client = Garmin(GARMIN_ID, GARMIN_PW)
client.login()
Downloading Garmin data
This step is run by the activitiesToGpx function defined in gmFunctions.py.
Here there’s a loop over the activity types which downloads the data from the
Garmin Connect API:
activities = client.get_activities_by_date(dateStart.strftime(dateFmt), dateEnd.strftime(dateFmt), activityType)
All activities of activityType type are stored in the activities list.
Note: at this stage the gpx tracks are not yet downloaded - to save on
bandwidth: only the information about an activity is downloaded (start date,
ID, user, etc.).
This step is followed by a second loop which actually downloads and saves any
new gpx tracks in their unique files
gpxFiles/<activityType>/<dateOfActivity>.gpx.
if not os.path.isfile(output_file):
    gpx_data = client.download_activity(activity_id, dl_fmt=client.ActivityDownloadFormat.GPX)
    with open(output_file, 'wb') as fb:
        fb.write(gpx_data)
This allows you to re-use the downloaded files, run the map-building function as standalone without having to re-connect to the Garmin API, or any other idea that may pop up in your mind.
Building and saving maps
This step is run by the buildMaps function defined in gmFunctions.py.
At first the map is initialized with some (currently hard-coded) defaults,
such as initial location, zoom level, tile layers and similar:
fmap = folium.Map(
        tiles=None,
        location=[47.34967, 8.53660],
        zoom_start=13,
        control_scale=True,
        prefer_canvas=True,
        )
folium.TileLayer('Stamen Terrain',      name='Stamen Terrain'     ).add_to(fmap)
folium.TileLayer('Stamen Toner',        name='Stamen Toner'       ).add_to(fmap)
folium.TileLayer('CartoDB dark_matter', name='CartoDB dark matter').add_to(fmap)
folium.TileLayer('OpenStreetMap',       name='OpenStreet Map'     ).add_to(fmap)
fplugins.Fullscreen(
        position='topright',
        title='Fullscreen',
        title_cancel='Exit Fullscreen',
        force_separate_button=True,
        ).add_to(fmap)
heatMapData = pd.DataFrame([])
The code then proceeds to add individual tracks to the map (and heat map).
It loads and parses the gpx files with gpxpy, converting the data to pandas
DataFrames:
gpx_df, gpx_points, gpx = gpxParse(open(os.path.join(inputDir, gpxFile)))
and adds the track in GeoJSON format to a list of ‘features’:
geojsonProperties = {
        'Time'     : trackStart,
        'Distance' : '{0:.2f} km'.format(gpx.length_3d()/1000),
        'Duration' : '{0:s}'     .format(str(timedelta(seconds=gpx.get_duration()))),
        'Climbed'  : '{0:d} m'   .format(int(gpx.get_uphill_downhill().uphill)),
        'Descended': '{0:d} m'   .format(int(gpx.get_uphill_downhill().downhill)),
        }
feature = df_to_geojsonF(gpx_df, properties=geojsonProperties),
# add this feature (aka, converted dataframe) to the list of features inside our dict
gjTracks['features'].append(feature)
Why go through the hustle of converting to GeoJSON instead of using Folium’s
simpler PolyLines?
Because with GeoJSON we can add a popup for each individual track with all the
custom information we have added above in the Properties dictionary:
folium.GeoJson(
        gjTracks,
        tooltip=folium.GeoJsonTooltip(fields=['Time'], labels=False),
        popup=folium.GeoJsonPopup(fields=list(geojsonProperties.keys())),
        style_function     = lambda x: {'color':'blue', 'weight':3, 'opacity':.5},
        highlight_function = lambda x: {'color':'red',  'weight':3, 'opacity':1},
        name='GPX tracks'
        ).add_to(fmap)
And there you have it. Now the map is saved in an html file in the maps
directory, ready to open with your favourite web browser or embed in your
website.


Comments